![]()
![]()
![]()
![]()
![]()
This section describes launching WindView; both the integrated and optional products with the default settings use the same process. For information on installing the optional product, see 2.4 WindView Optional Product.
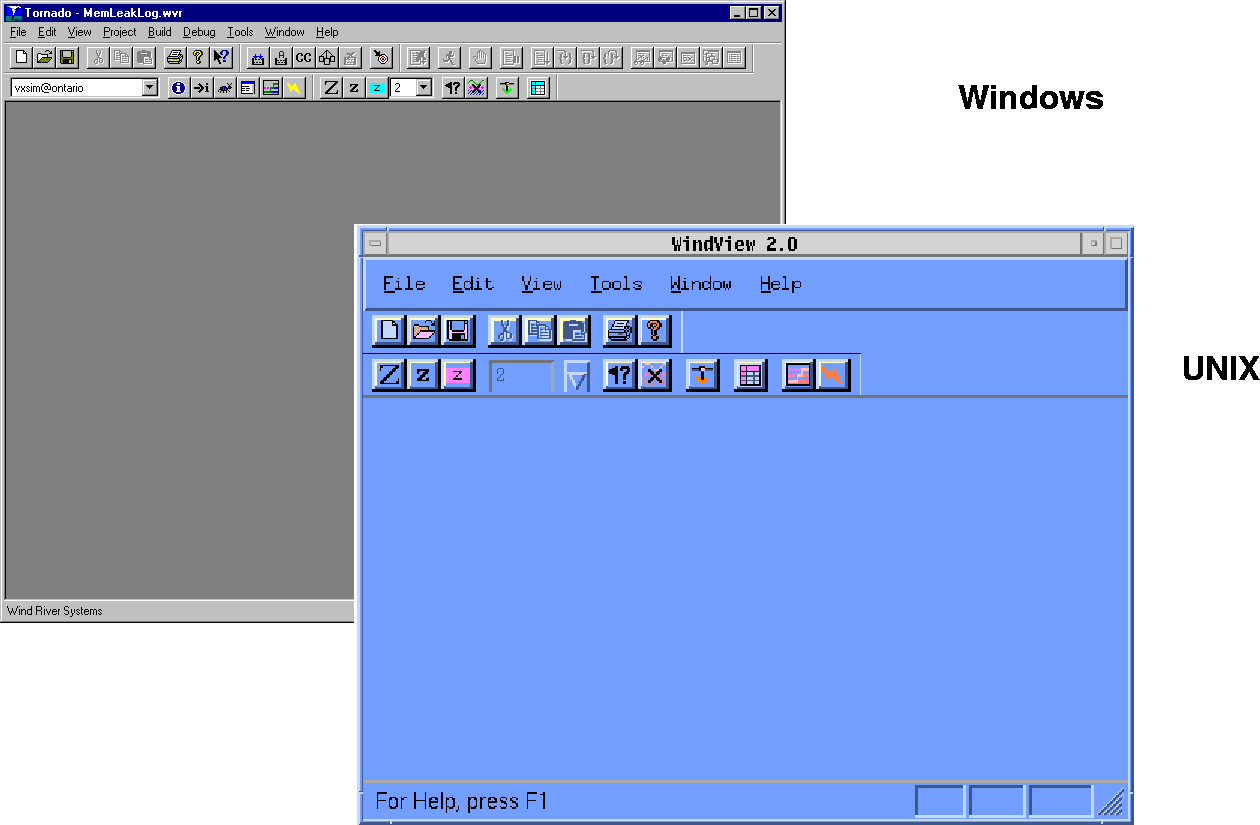
There are slight differences between the launch process and the work environment for Windows and UNIX. In a Windows application, all subwindows, dialog boxes, and other elements reside in a master window. Thus WindView for Windows resides in the main Tornado window. In a UNIX application, each task or function exists in a separate window. When you launch WindView for UNIX, a main WindView control window opens, within which all WindView subwindows and dialog boxes appear. Throughout this manual the main Tornado window on Windows hosts and the main WindView window on UNIX hosts is called the main window and the menus at the top of this window will be called the main Tools menu, the main Help menu, and so on (see Figure 2-1).
To launch WindView on a Windows host, select WindView>Configuration from the main Tools menu or click the  button on the main toolbar. Either method displays the Collection Configuration dialog box (see Figure 2-2).
To launch WindView on a UNIX host, click the WindView button at the bottom of the Tornado Launch window and then click the  button on the main toolbar to display the Collection Configuration dialog box (see Figure 2-2).
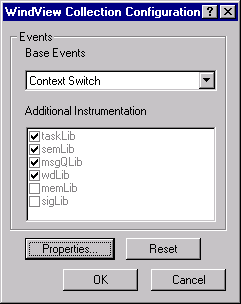
From this step on, the Windows and UNIX versions of WindView look the same except for stylistic differences in the windows. In either environment, WindView displays a Collection Configuration dialog box similar to Figure 2-3.
The default specifies that the Base Events are collected at the Context Switch event-logging level, in other words, only events that cause context switches are logged. This is the lowest level of collection and is usually referred to as CSE level logging; for more information on what data is logged for the different levels, see 3.2 Selecting a Logging Level. A list of libraries called Additional Instrumentation appears, but it is grayed out in the default configuration. For a discussion of collecting data from additional instrumented libraries, see 3.3 Instrumented Objects.
The Reset button resets all the WindView settings to the defaults. The first time you run WindView, click Reset to assure that you are using the default settings.
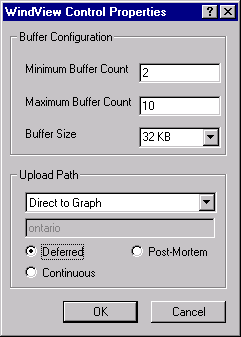
Pressing the Properties button brings up the Control Properties dialog box. This dialog box allows you to configure the collection buffers and the upload path. After you familiarize yourself with the defaults described below, accept them by clicking OK. Also accept the defaults in the Collection Configuration dialog box with OK.
The default configuration starts with two 32KB buffers. When these buffers are full, additional buffers are added as needed up to a maximum of ten. Then data collection stops. For a discussion of how to modify the buffers and why you would wish to do so, see 4.2 Dynamic Ring Buffer. For detailed information about the WindView ring buffers, see 7.7 Dynamic Buffer Allocation.
The default upload path is Direct to Graph. This method uses all default settings and places the uploaded data directly into a view graph. For a discussion of the other alternatives presented in the drop-down combo box, see 4.3 Upload Path and Destination. For detailed information about the various upload paths, see 8.3 Data Upload to the Host.
The default upload mode is Deferred. This means that data remains in the buffer until you request upload. For a discussion of the upload mode alternatives, see 4.4 Upload Mode. For detailed information about upload modes, see 8.2 Data Upload Mode.
Follow the instructions in Tornado Getting Started to start a simulator and target server. If you have changed the target server defaults, see Configuring the Target Server for TSFS. (TSFS is required for the integrated simulator.) Once you have a target and a target server and have launched WindView, you can start WindView data collection. Click the  button on the Control window.
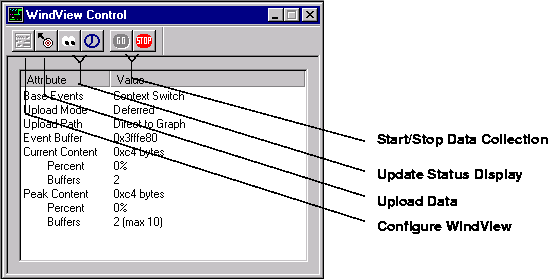
While WindView is running, click the  button; the Current Content and Peak Content fields in the lower half of the Control window are updated. To obtain a regular update of the log status while event collection continues, press the
  button; it causes the information fields to be updated every 20 seconds.
While a regular update is useful, each query to the target from WindView generates additional events. Thus a regular update increases the amount of intrusion caused by WindView on the log data you collect.
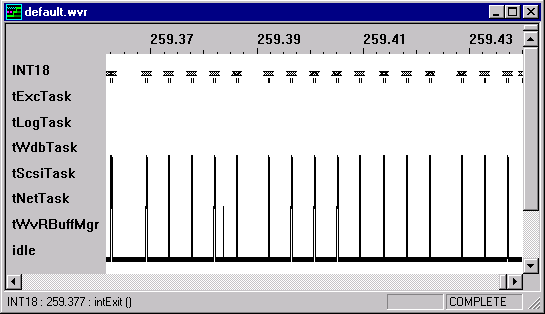
The default configuration uploads the data directly into a view graph. Click the  button on the Control window. A new view graph opens containing your log data. The log file looks similar to Figure 2-5.
![]()
![]()
![]()
![]()
![]()
 button on the Control window. (Don't worry about not having enough data. Even an idling target generates significant events.)