
Public Member Functions | |
| Profiler (const int queue_interval_check) | |
| ~Profiler () | |
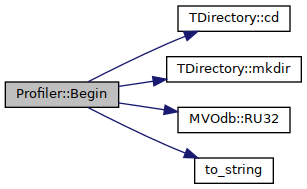
| void | Begin (TARunInfo *runinfo, const std::vector< TARunObject * > fRunRun) |
| void | LogAnalyzeEvent (TAFlags *flag, TAFlowEvent *flow, const int i, const TAClock &start) |
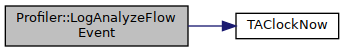
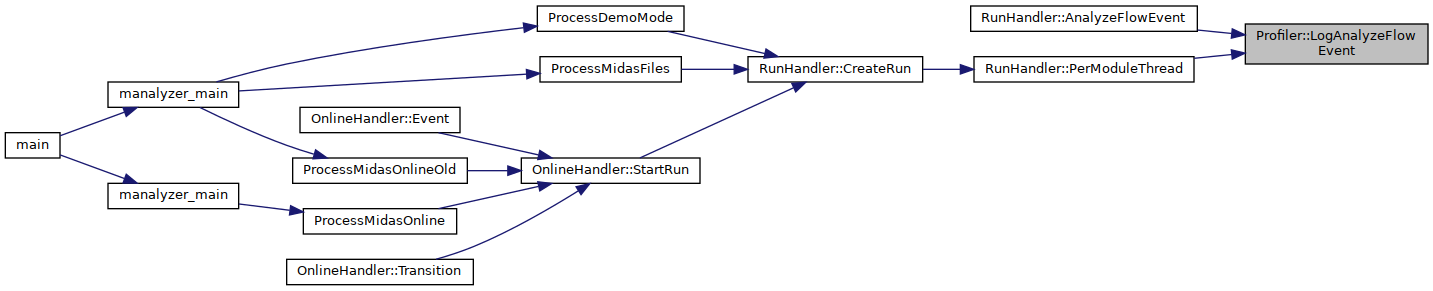
| void | LogAnalyzeFlowEvent (TAFlags *flag, TAFlowEvent *flow, const int i, const TAClock &start) |
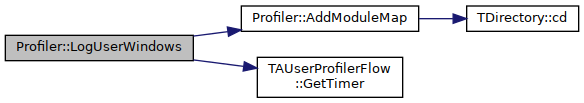
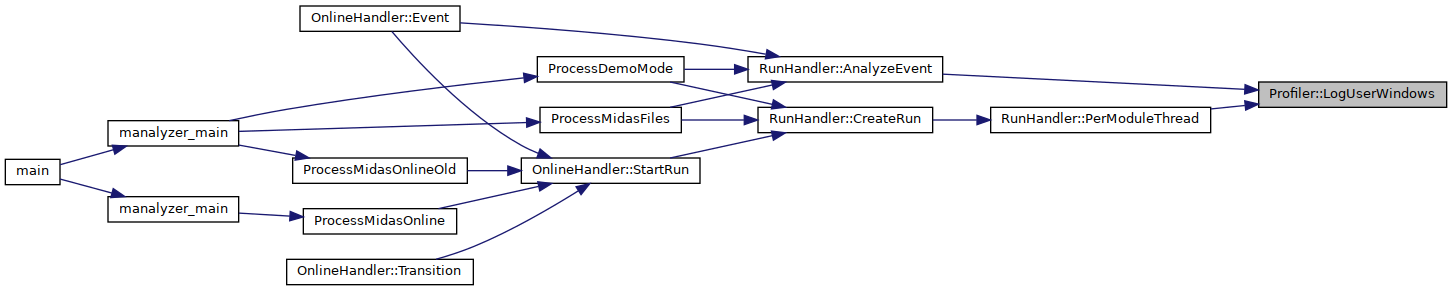
| void | LogUserWindows (TAFlags *flag, TAFlowEvent *flow) |
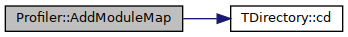
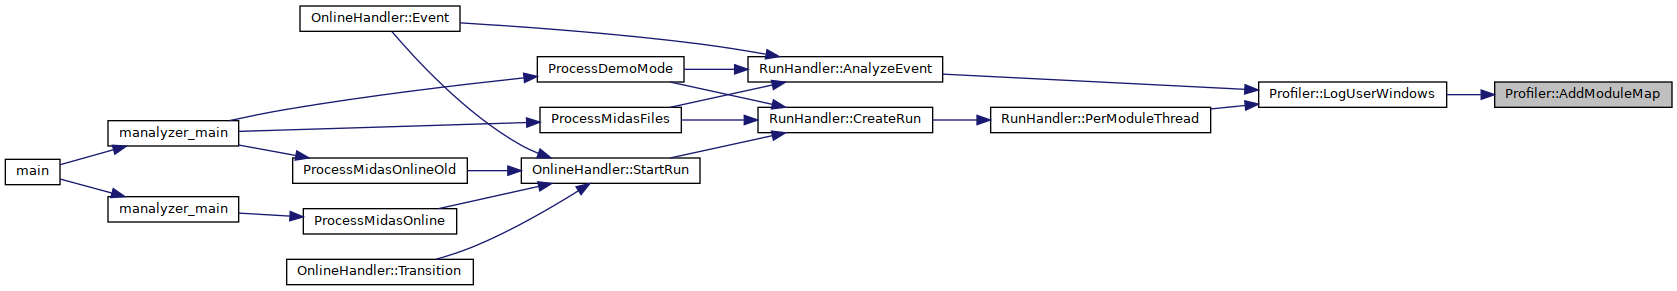
| void | AddModuleMap (const char *UserProfileName, unsigned long hash) |
| void | LogMTQueueLength (TARunInfo *runinfo) |
| void | End (TARunInfo *runinfo) |
| void | Print () const |
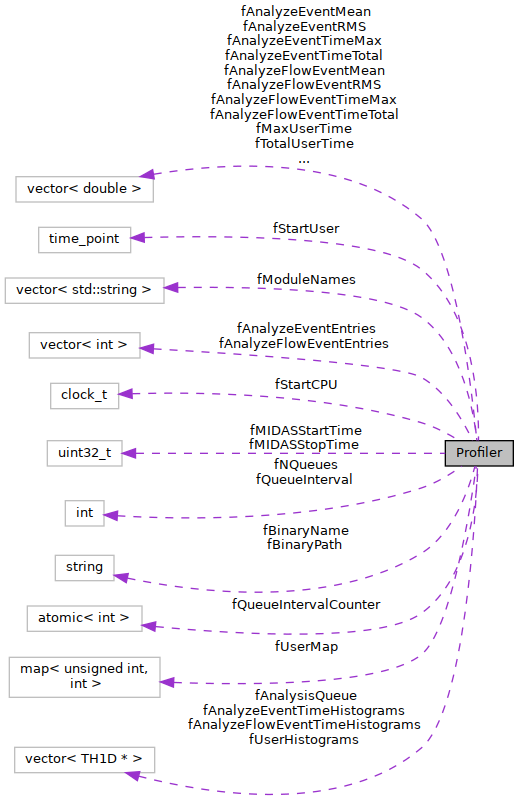
Private Attributes | |
| std::string | fBinaryName |
| std::string | fBinaryPath |
| clock_t | fStartCPU |
| std::chrono::system_clock::time_point | fStartUser |
| uint32_t | fMIDASStartTime |
| uint32_t | fMIDASStopTime |
| int | fNQueues =0 |
| std::vector< TH1D * > | fAnalysisQueue |
| std::atomic< int > | fQueueIntervalCounter |
| std::vector< TH1D * > | fAnalyzeEventTimeHistograms |
| std::vector< std::string > | fModuleNames |
| std::vector< double > | fAnalyzeEventMean |
| std::vector< double > | fAnalyzeEventRMS |
| std::vector< int > | fAnalyzeEventEntries |
| std::vector< double > | fAnalyzeEventTimeMax |
| std::vector< double > | fAnalyzeEventTimeTotal |
| std::vector< TH1D * > | fAnalyzeFlowEventTimeHistograms |
| std::vector< double > | fAnalyzeFlowEventMean |
| std::vector< double > | fAnalyzeFlowEventRMS |
| std::vector< int > | fAnalyzeFlowEventEntries |
| std::vector< double > | fAnalyzeFlowEventTimeMax |
| std::vector< double > | fAnalyzeFlowEventTimeTotal |
| std::map< unsigned int, int > | fUserMap |
| std::vector< TH1D * > | fUserHistograms |
| std::vector< double > | fTotalUserTime |
| std::vector< double > | fMaxUserTime |
| const int | fQueueInterval = 100 |
Detailed Description
Definition at line 540 of file manalyzer.cxx.
Constructor & Destructor Documentation
◆ Profiler()
| Profiler::Profiler | ( | const int | queue_interval_check | ) |
Definition at line 606 of file manalyzer.cxx.
◆ ~Profiler()
| Profiler::~Profiler | ( | ) |
Definition at line 621 of file manalyzer.cxx.
Member Function Documentation
◆ AddModuleMap()
| void Profiler::AddModuleMap | ( | const char * | UserProfileName, |
| unsigned long | hash | ||
| ) |
Definition at line 848 of file manalyzer.cxx.
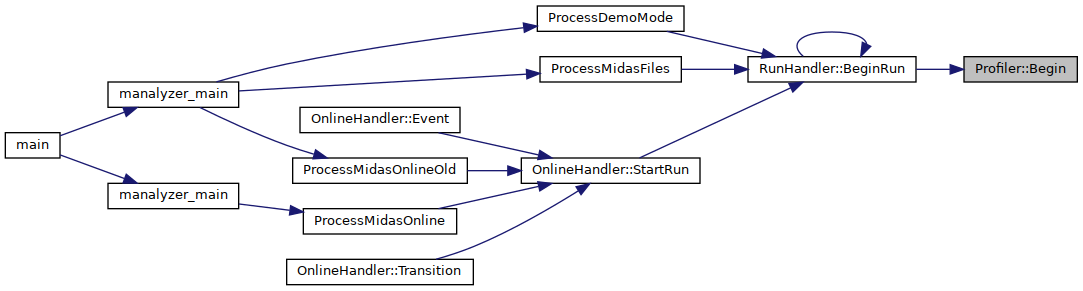
◆ Begin()
| void Profiler::Begin | ( | TARunInfo * | runinfo, |
| const std::vector< TARunObject * > | fRunRun | ||
| ) |
Definition at line 639 of file manalyzer.cxx.
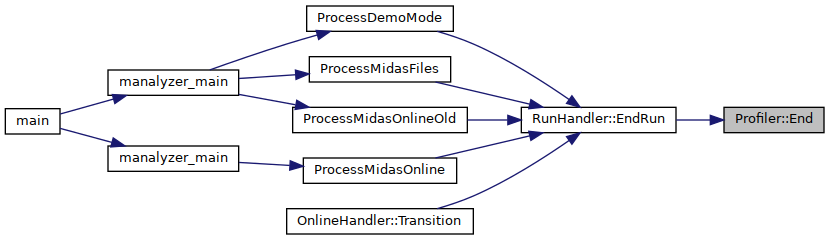
◆ End()
| void Profiler::End | ( | TARunInfo * | runinfo | ) |
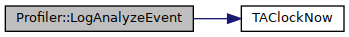
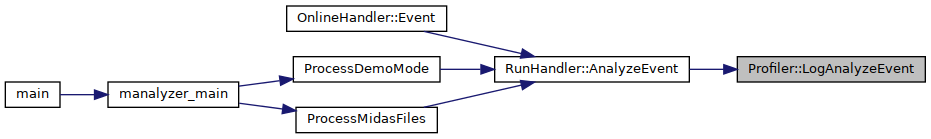
◆ LogAnalyzeEvent()
| void Profiler::LogAnalyzeEvent | ( | TAFlags * | flag, |
| TAFlowEvent * | flow, | ||
| const int | i, | ||
| const TAClock & | start | ||
| ) |
Definition at line 761 of file manalyzer.cxx.
◆ LogAnalyzeFlowEvent()
| void Profiler::LogAnalyzeFlowEvent | ( | TAFlags * | flag, |
| TAFlowEvent * | flow, | ||
| const int | i, | ||
| const TAClock & | start | ||
| ) |
Definition at line 733 of file manalyzer.cxx.
◆ LogMTQueueLength()
| void Profiler::LogMTQueueLength | ( | TARunInfo * | runinfo | ) |

◆ LogUserWindows()
| void Profiler::LogUserWindows | ( | TAFlags * | flag, |
| TAFlowEvent * | flow | ||
| ) |
Definition at line 811 of file manalyzer.cxx.
◆ Print()
| void Profiler::Print | ( | ) | const |
Field Documentation
◆ fAnalysisQueue
|
private |
Definition at line 553 of file manalyzer.cxx.
◆ fAnalyzeEventEntries
|
private |
Definition at line 564 of file manalyzer.cxx.
◆ fAnalyzeEventMean
|
private |
Definition at line 562 of file manalyzer.cxx.
◆ fAnalyzeEventRMS
|
private |
Definition at line 563 of file manalyzer.cxx.
◆ fAnalyzeEventTimeHistograms
|
private |
Definition at line 559 of file manalyzer.cxx.
◆ fAnalyzeEventTimeMax
|
private |
Definition at line 566 of file manalyzer.cxx.
◆ fAnalyzeEventTimeTotal
|
private |
Definition at line 567 of file manalyzer.cxx.
◆ fAnalyzeFlowEventEntries
|
private |
Definition at line 575 of file manalyzer.cxx.
◆ fAnalyzeFlowEventMean
|
private |
Definition at line 573 of file manalyzer.cxx.
◆ fAnalyzeFlowEventRMS
|
private |
Definition at line 574 of file manalyzer.cxx.
◆ fAnalyzeFlowEventTimeHistograms
|
private |
Definition at line 571 of file manalyzer.cxx.
◆ fAnalyzeFlowEventTimeMax
|
private |
Definition at line 577 of file manalyzer.cxx.
◆ fAnalyzeFlowEventTimeTotal
|
private |
Definition at line 578 of file manalyzer.cxx.
◆ fBinaryName
|
private |
Definition at line 543 of file manalyzer.cxx.
◆ fBinaryPath
|
private |
Definition at line 544 of file manalyzer.cxx.
◆ fMaxUserTime
|
private |
Definition at line 584 of file manalyzer.cxx.
◆ fMIDASStartTime
|
private |
Definition at line 547 of file manalyzer.cxx.
◆ fMIDASStopTime
|
private |
Definition at line 548 of file manalyzer.cxx.
◆ fModuleNames
|
private |
Definition at line 561 of file manalyzer.cxx.
◆ fNQueues
|
private |
Definition at line 552 of file manalyzer.cxx.
◆ fQueueInterval
|
private |
Definition at line 587 of file manalyzer.cxx.
◆ fQueueIntervalCounter
|
private |
Definition at line 554 of file manalyzer.cxx.
◆ fStartCPU
|
private |
Definition at line 545 of file manalyzer.cxx.
◆ fStartUser
|
private |
Definition at line 546 of file manalyzer.cxx.
◆ fTotalUserTime
|
private |
Definition at line 583 of file manalyzer.cxx.
◆ fUserHistograms
|
private |
Definition at line 582 of file manalyzer.cxx.
◆ fUserMap
|
private |
Definition at line 581 of file manalyzer.cxx.
The documentation for this class was generated from the following file:
- manalyzer/manalyzer.cxx